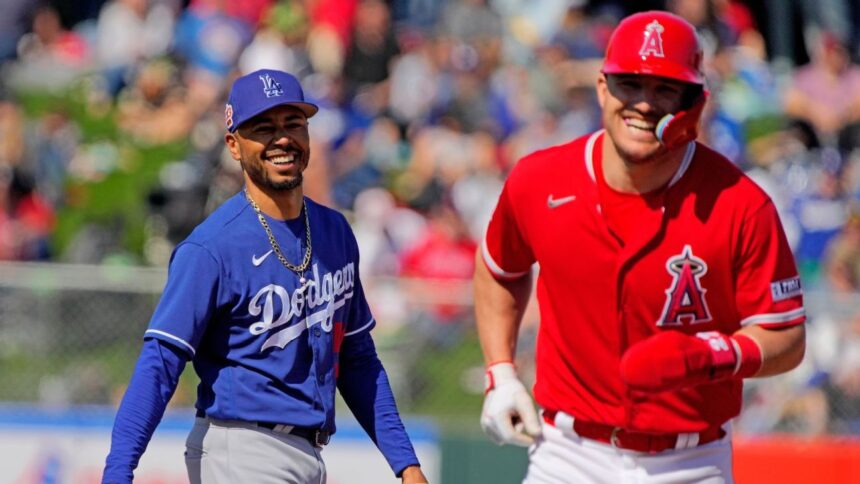
Mike Trout vs. Mookie Betts: Who dominates the Alpha Generation era?
For nearly a decade, Mike Trout was undeniably the best baseball player. However, injuries have hampered his career, opening the debate on whether Mookie Betts could surpass him as the most outstanding player of his generation.
From 2012 to 2019, Trout won the American League Most Valuable Player (MVP) award three times and finished second in the voting four times. In the years he didn’t win, he led the American League three times in WAR (Wins Above Replacement). In 2017, he led the American League in OBP, slugging, and OPS, but due to time off the field, he finished fourth in the voting. In 2018, he needed an exceptional season from Mookie Betts to be surpassed by Trout in what was one of Trout’s best seasons. Really, he was close to winning eight consecutive MVP awards.
But since then, it seems we’ve missed the second half of the career of one of the all-time greats. Trout has suffered injuries since 2021, playing in only about 42% of the Los Angeles Angels’ games. Currently, he is injured again due to a bone bruise in his left knee. When he has played this season, he hit nine home runs in 29 games, but he also batted only .179. He had similar results in the 29 games he played before tearing his meniscus in his left knee last season, when he batted .220 with 10 home runs. Acknowledging that injuries and Trout’s age, which is 33, have caught up with him, the Angels finally moved him from center field this season.
These prolonged absences have allowed Betts, who continues to play at a high level and ranks third among position players in WAR this decade, to slowly close the gap with Trout. Now it’s an argument to consider: Is Betts ready to surpass Trout as the best player of his generation?
To better understand this, let’s define “his generation.” When discussing generations in demographic terms, the division is made by birth years, generally lasting between 15 and 20 years. Trout was born in 1991, so, under this definition, his “generation” could extend from players born in the 1970s to the late 2000s, including players like Derek Jeter (1974), Alex Rodriguez (1975), Albert Pujols (1980), Clayton Kershaw (1988), Juan Soto (1998), Paul Skenes (2002), and Jackson Merrill (2003).
Instead, let’s analyze the generational value using the same years defined in popular culture, such as Baby Boomers, Gen X, etc., but with a twist: analyzing the accumulated value only in those specific years (not in the years the players were born).
This is as much a mental exercise as it is a rigorous statistical study, because we talk about generations (or eras) all the time in baseball: the dead-ball era, the steroid era, the wild-card era, etc. As we delve into how Trout and Betts compare, we’ll also analyze each generation to see which players dominated those periods in the sport, ending with the great Generation Alpha debate between Trout and Betts (and yes, Aaron Judge and Shohei Ohtani might also appear).
Trout vs. Betts: Numerical Comparison
Trout accumulated so much WAR at such a young age that we used to do monthly updates on all the players he had surpassed on the all-time WAR list. His run began as a rookie in 2012, in his age-20 season, when he hit .326 with 30 home runs and led the American League in runs scored and stolen bases. And for a long time, he seemed destined to become one of the greatest players of all time.
Let’s see where each player ranked on the all-time WAR list for position players at each age:
- Age 20, season 2012: 11.0 (second behind Mel Ott)
- Age 21, 2013: 19.9 (first, ahead of Ott)
- Age 22, 2014: 27.6 (first, ahead of Ty Cobb and Ott)
- Age 23, 2015: 37.1 (first, ahead of Cobb and Ted Williams)
- Age 24, 2016: 47.5 (first, ahead of Cobb and Mickey Mantle)
- Age 25, 2017: 54.4 (second, behind Cobb)
- Age 26, 2018: 64.3 (first, ahead of Cobb and Mantle)
- Age 27, 2019: 72.2 (first, ahead of Cobb and Mantle)
Then, starting with the 2020 season, shortened by COVID, Trout’s pace slowed.
- Age 28, 2020: 74.0 (fourth, behind Cobb, Rogers Hornsby and Mantle)
- Age 29, 2021: 75.9 (sixth, now behind Ott and Alex Rodriguez)
- Age 30, 2022: 82.0 (fifth, again ahead of Ott)
- Age 31, 2023: 84.9 (10th, with Babe Ruth, Henry Aaron and Willie Mays surpassing him)
- Age 32, 2024: 86.0 (15th, with Barry Bonds passing him for the first time)
This brings us to 2025, Trout’s age-33 season. He currently sits on the all-time list between Jimmie Foxx and Eddie Mathews, two players who, coincidentally, had already accumulated more than 89% of their career WAR by their age-32 seasons.
Meanwhile, with Trout missing so many games in recent years, Betts began to close in on Trout for the title of best player of their generation. Trout still has a significant lead in career WAR, 85.8 to 72.2, but consider Betts’ advantages in this statistical chase:
- He is one year younger (Trout was born in August 1991, Betts in October 1992).
- He is playing at a higher level, averaging 7.8 WAR per 162 games since 2022, compared to 6.2 for Trout (we went back to 2022 to include Trout’s high production rate that season).
- Obviously, he has stayed on the field much more, playing 579 games since 2021 compared to 295 for Trout.
- His ability to move to the shortstop position means he will continue to accumulate more defensive value.
Betts has also been incredibly consistent in the age/WAR table:
- At age 23: 18.1 (33rd)
- At age 26: 42.5 (21st)
- At age 29: 57.0 (28th)
- At age 31: 70.3 (24th)
Betts had a slight decline at age 29 due to the COVID-shortened season and then had the worst season of his career in 2021, when he produced 4.1 WAR (still a solid season for most players), but rebounded with 6.7, 8.6, and 4.8 WAR in the following three seasons. (That 4.8 WAR number from 2024 came in 116 games, as he missed time due to a broken hand after being hit by a pitch).
He hasn’t had a brilliant start in 2025, but he’s still on track for another 6-win season. If he does this season and the next, he would be around 83 career WAR at the end of 2026, his age 33 season, which would put him in 20th place in the rankings at that age, just behind where Trout is.
There is no guarantee of how Betts will age in his late 30s, but a key attribute he has been able to maintain as he ages is his contact ability. In fact, Betts’ lowest career strikeout rates have been in 2024 (11.0%) and 2025 (9.2%). Meanwhile, Trout has recorded his worst strikeout rates in 2023 (28.7%) and 2025 (29.8%). Those numbers point to Betts continuing to age well and post respectable offensive numbers, while Trout will likely continue to post low batting averages mixed with some home runs.
This makes catching Trout seem feasible for Betts, unless Trout has a career renaissance. History might prove how improbable that is. Mantle and Ken Griffey Jr., two other all-time great center fielders, battled injuries in their 30s and were never able to regain their former glory. Mantle had just 11.9 WAR from age 33 on, and Griffey had just 6.4.
Where do Judge and Ohtani fit in? We’ll get back to Generation Alpha in a moment, after we analyze how the debates about the best players of past generations unfolded.
Generational Analysis
Asking “Who is the best player?” is not necessarily an easy question with a simple answer. There can be three different ways to approach this:
- Who has the most accumulated value in this period? We will use WAR, as we did previously with Trout and Betts.
- Who has the highest peak performance level over a smaller number of seasons? Trout dominated the sport for eight seasons.
- Who is the most iconic player of this generation? That’s a more diffuse notion, but it’s more about which player will be most remembered or who best defines a particular era.
We will delve into the three for each generation. Let’s start in 1901.
The Golden Generation (1901-27)

Legend: Babe Ruth, left, and Ty Cobb were two of the best talents of their generation, but Cobb was probably more appreciated at the time.
Bettmann/Getty Images
- Top 5 in WAR
- Walter Johnson: 155.1
- Ty Cobb: 149.4
- Tris Speaker: 134.4
- Babe Ruth: 133.5
- Eddie Collins: 124.2
Following five: Honus Wagner (113.8), Grover Alexander (111.3), Christy Mathewson (101.1), Rogers Hornsby (100.8), Nap Lajoie: 89.3
Best peak: 1. Ruth, 1921-27 (10.3 WAR average per season); 2. Johnson, 1912-19 (11.5 WAR average per season); 3. Hornsby, 1920-25 (9.9 WAR average per season, batted .397)
Most iconic player: Ruth
The greatest debate of this generation: Cobb and the dead-ball era vs. Ruth and the home run
Ruth, of course, had additional value beyond 1927 that carried him past Cobb in career WAR. But the idea that Ruth was the superior player wasn’t necessarily the widespread view until around 1960, and, of course, modern metrics now clearly show Ruth as the more valuable player. In the first Hall of Fame vote in 1936, Cobb received more votes and many contemporaries appreciated him in a more “scientific” era of baseball.
“The Babe was a great baseball player, sure, but Cobb was even better. Babe could knock your brains out, but Cobb would drive you crazy,” said Speaker, who played against both.
Speaker
The Silent Generation (1928-45)

Legend: Lou Gehrig was one of the most iconic players during his career.
Mark Rucker/Transcendental Graphics, Getty Images
- Top 5 in WAR
- Mel Ott: 111.8
- Lefty Grove: 98.0
- Lou Gehrig: 91.2
- Jimmie Foxx: 90.9
- Charlie Gehringer: 79.9
Following five: Arky Vaughan (75.9), Carl Hubbell (68.8), Joe Cronin (64.5), Paul Waner (62.2), Babe Ruth (58.9)
Best peak: 1. Ruth, 1928-32 (9.5 WAR average per season); 2. Gehrig, 1930-36 (8.8 WAR average per season, averaged 155 RBIs); 3. Grove, 1928-33 (8.8 WAR average per season, averaged 25 wins)
Most Iconic: Ruth/Gehrig/Joe DiMaggio
The greatest debate of this generation: DiMaggio vs. Ted Williams
Ruth was that good: He snuck into the top 10 in career value in two different generations, including that monstrous five-year run when he hit .348/.475/.701 and led the American League four times in WAR, averaging 47 home runs and 150 RBIs. Ott’s career overlaps perfectly with this timeline, as his first full season was at age 19 with the New York Giants in 1928 and his last as a starter was in 1945. He was a truly great, and underrated, but rarely remembered player now.
But the most compelling debate began near the end of this generation. DiMaggio reached the majors in 1936 and the Yankees immediately won four consecutive World Series and then another in 1941. Williams reached the majors in 1939 and hit .406 in 1941, and finished second in the MVP voting behind DiMaggio (who had his 56-game hitting streak that season). Who was better? Are DiMaggio’s World Series rings more impressive than Williams’ statistical superiority? The player with the record-breaking hitting streak or the last player to hit .400? The debate would continue into the early years of the next generation (Williams won the Triple Crown in 1947, but DiMaggio won the MVP award again).
Baby Boomers (1946-64)

Legend: Willie Mays averaged 9.4 WAR from 1954 to 1964 with the Giants.
Bettman/Getty Images
- Top 5 in WAR
- Willie Mays: 108.9
- Stan Musial: 104.1
- Mickey Mantle: 98.4
- Warren Spahn: 92.5
- Ted Williams: 87.7
Following five: Eddie Mathews (85.9), Henry Aaron (80.8), Robin Roberts (80.6), Duke Snider (65.9), Richie Ashburn (64.3)
Best peak: 1. Mays, 1954-64 (9.4 WAR average per season for over a decade); 2. Mantle, 1955-58 (10.2 WAR average per season); 3. Williams, 1946-1949 (9.4 WAR average per season)
Most iconic: Mantle
The greatest debate of this generation: Mays vs. Mantle
Mays on Musial and Mantle as the best player of the Baby Boomers generation is not a sure thing. Musial gets two of his three MVP awards in this time period and Mantle gets all three; Mays only won one (with the second coming in 1965). Musial also finished second in the MVP voting four times and had a large number of other top-10 finishes (as did Mays, of course). At his best, Mantle was a better hitter than Mays:
Mantle, 1954-64: .312/.440/.605, 397 HR, 185 OPS+, 622 batting runs above averageMays, 1954-64: .318/.392/.601, 429 HR, 166 OPS+, 561 runs created above average
As for iconic, it’s Mantle over Mays, Musial, and Williams, with Jackie Robinson meriting an honorable mention as a different kind of icon. Musial might have been the most popular player in the entire sport at the time. Mantle was in the World Series almost every year with the Yankees, won seven of them, and even now, his baseball cards still command the highest premium. Ask any Baby Boomer: The Yankees defined the 1950s and Mantle defined the Yankees.
Generation X (1965-80)

Legend: Pete Rose was possibly the most popular player during his playing days due to his Charlie Hustle personality.
AP Photo/G. Paul Burnett, Archivo
- Top 5 in WAR
- Joe Morgan: 88.8
- Tom Seaver: 88.8
- Gaylord Perry: 84.0
- Phil Niekro: 82.5
- Carl Yastrzemski: 80.3
Following five: Ferguson Jenkins (78.2), Pete Rose (76.7), Johnny Bench (72.9), Reggie Jackson (70.0), Rod Carew (69.8)
Best peak: 1. Morgan, 1972-76 (9.6 WAR average per season); 2. Bob Gibson, 1965-70 (7.6 WAR average per season, led all players in WAR in 1968, 1969, and 1970); 3. Mike Schmidt, 1974-80 (8.2 WAR average per season)
Most iconic: Rose or Reggie … or Nolan Ryan?
The biggest debate of this generation: Rose or Reggie … or Nolan Ryan?
This generation shows how the peak value can cement a player’s legacy. Gibson didn’t have the career value of pitchers Perry or Niekro, but his legacy is much stronger. In fact, that five-year peak would be even higher, except that he broke his leg in 1967, only to return and win three games in the World Series.
The most iconic debate is the interesting one. Throughout the 1970s, Rose and Reggie were the towering figures in the game: Charlie Hustle and Mr. October. They weren’t the best players, but Rose was the most popular, Jackson the most controversial. Even Rose’s recent reinstatement shows how he continues to impact headlines, even after his death. Ryan would be a late entry to the icon discussion. He didn’t really become an iconic figure until the end of his career with the Texas Rangers in the late 1980s and early 1990s, when he kept racking up no-hitters and strikeouts well into his 40s, but now he possesses a larger-than-life persona that might even surpass Rose and Jackson.
Millennials (1981-96)

Legend: Barry Bonds’ early peak years produced three MVP awards, but he probably wasn’t the most iconic player of his time.
Jeff Carlick/MLB Photos via Getty Images
- Top 5 in WAR
- Rickey Henderson: 95.7
- Cal Ripken: 88.8
- Wade Boggs: 88.2
- Barry Bonds: 83.6
- Roger Clemens: 80.8
Following five: Ryne Sandberg (67.1), Ozzie Smith (66.9), Tim Raines (66.5), Lou Whitaker (65.1), Alan Trammell (63.0)
Best peak: 1. Bonds, 1990-96 (8.6 WAR average per season, three MVP awards); 2. Greg Maddux, 1992-96 (8.1 WAR average per season, four Cy Young awards); 3. Roger Clemens, 1986-92 (8.3 WAR average per season, three Cy Youngs)
Most iconic: Ken Griffey Jr.
The greatest debate of this generation: Bonds vs. Griffey
Look… even before the supposed performance-enhancing substances, Bonds was a better player than Griffey. Bonds’ 1993 season, right before the offensive explosion across the sport, was a season for the ages: .336/.458/.677, 9.9 WAR. He had an OPS+ of 206; from 1962 to 1993, only four players had an OPS+ higher than 200: Willie McCovey in 1969, George Brett in 1980, and Bonds in 1992 and ’93.
From 1991 to 1998, Griffey’s peak, he averaged 7.2 WAR per season and led American League position players three times in WAR. From 1990 to 1998, Bonds averaged 8.5 WAR and led National League position players seven times in WAR. Bonds got on base more and was the better base stealer, and although he didn’t play center field, he was a spectacular left fielder (especially early in his career with the Pittsburgh Pirates). In those days before WAR, the debate was much more contested and Griffey was generally considered the better player.
But the most iconic? El Niño by a landslide.
Generation Z (1997-2012)

Legend: Alex Rodriguez had the numbers but not the World Series rings to be as revered as another Yankee.
John Cordes/Icon Sportswire
- Top 5 in WAR
- Alex Rodríguez: 107.0
- Albert Pujols: 91.5
- Barry Bonds: 79.1
- Chipper Jones: 76.2
- Randy Johnson: 74.1
Following five: Pedro Martínez (71.6), Scott Rolen (70.4), Derek Jeter (69.9), Roy Halladay (66.5), Carlos Beltrán (65.5)
Best peak: 1. Bonds, 2000-04 (10.2 WAR average per season, four MVP awards); 2. Johnson, 1999-2002 (9.5 WAR average per season, four consecutive Cy Young awards, averaged 354 strikeouts); 3. Martínez, 1997-2000 (9.4 WAR average per season, 2.16 ERA)
Most iconic: Jeter
The biggest debate of this generation: Jeter vs. A-Rod
This era could surpass the others in terms of peak performance. We could have also listed Rodriguez, who averaged 8.3 WAR and 46 home runs from 1998 to 2005 (and that doesn’t include the 9.4 WAR seasons in 1996 and 2007). Or Pujols, who had seven consecutive seasons of over 8 WAR from 2003 to 2009. Or Mark McGwire’s four-year run from 1996 to 1999, when he averaged 61 home runs. Or Sammy Sosa averaging 58 home runs over a five-year span. Or Ichiro Suzuki’s incredible 10 consecutive seasons with 200 hits.
But the Jeter/A-Rod debate encompasses everything about this complicated era. In the end, Rodriguez had the numbers and Jeter the rings and the fists from the top step of the dugout.
Alpha Generation (2010-25)

Legend: Mookie Bet


